Objectives:
- Provide high level overview of valve market size and growth prospects
- Identify market drivers and threats
- Identify emerging trends and opportunities
Scope:
- Products: Valves and valve actuators
- Markets:Power, Oil & Gas, others
- Applications:Special focus on severe service valves
- Region: World overview
Venue:
- IndustrialValveSummit,Bergamo,Italy,May27-28,2015
Methodology:
- Market Sizing and Projections:
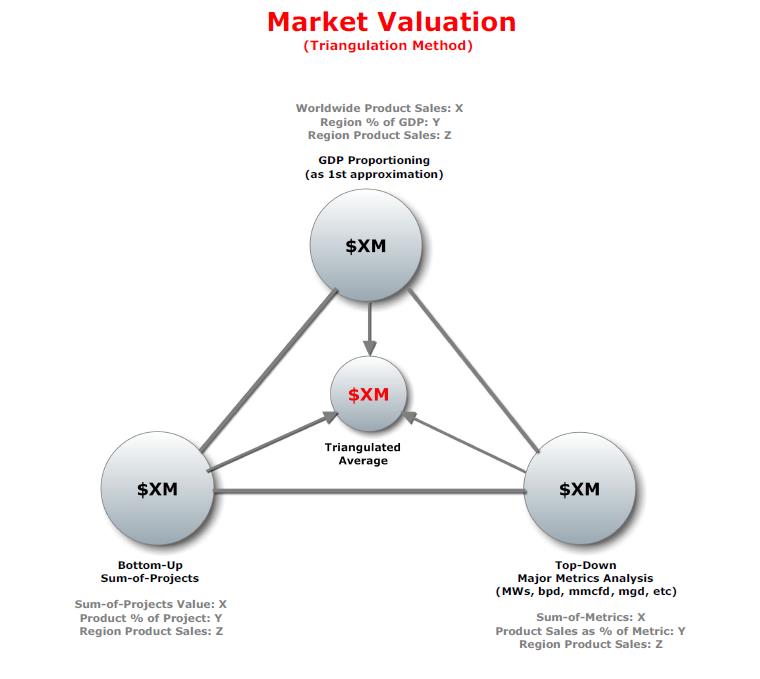
- Bottom-up analysis reflecting ongoing and planned project work
- Top-down analysis of macro market metrics including new MWs (for power), new bpd (for refinery), new mmcfd(for gas)
- McIlvaine custom research, including sum-of-sales analysis for suppliers, and other custom research for market size validation
Research Sources:
- McIlvaine primary research with suppliers, EPCs, and end users
- McIlvaine network of niche expert consultants and field resources
- Data mining within McIlvaine proprietary data base
- General research
Big Picture Overview
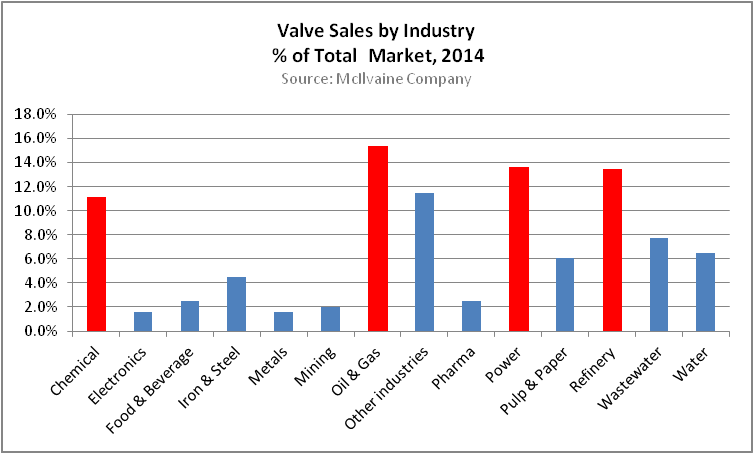
Valve Sales by Industry (%)
| Industry | 2015 | 2019 |
|---|---|---|
| Chemical | 6,470.23 | 7,649.03 |
| Electronics | 460.89 | 525.04 |
| Food | 1,471.42 | 1,719.65 |
| Iron & Steel | 2,686.86 | 3,418.82 |
| Metals | 928.69 | 1,084.66 |
| Mining | 1,193.05 | 1,477.83 |
| Oil & Gas | 8,742.44 | 9,379.90 |
| Other Electronics | 474.57 | 576.85 |
| Other Industries | 6,635.90 | 7,255.42 |
| Pharmaceutical | 1,496.63 | 1,732.69 |
| Power | 7,716.85 | 8,806.69 |
| Pulp & Paper | 3,534.21 | 4,207.23 |
| Refining | 7,731.28 | 9,081.64 |
| Wastewater | 4,384.30 | 4,696.76 |
| Water | 3,822.05 | 4,677.00 |
Narrative
+ Oil & Gas (upstream & midstream), Refinery (downstream), Power, and Chemical generate more than 50% of all valve sales, worldwide.
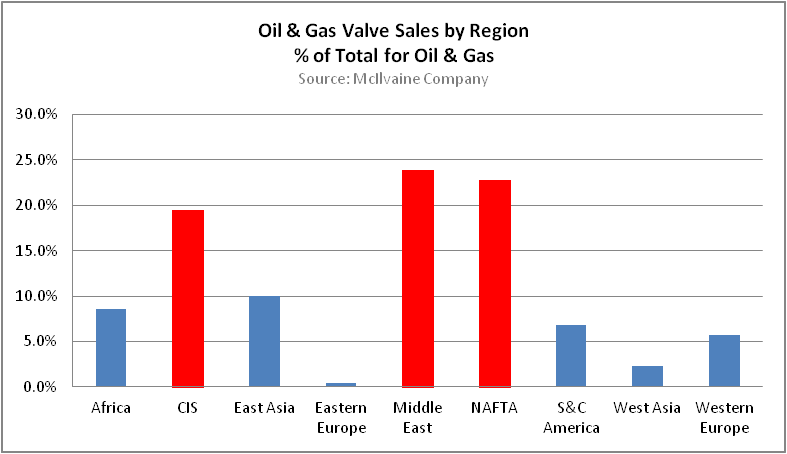
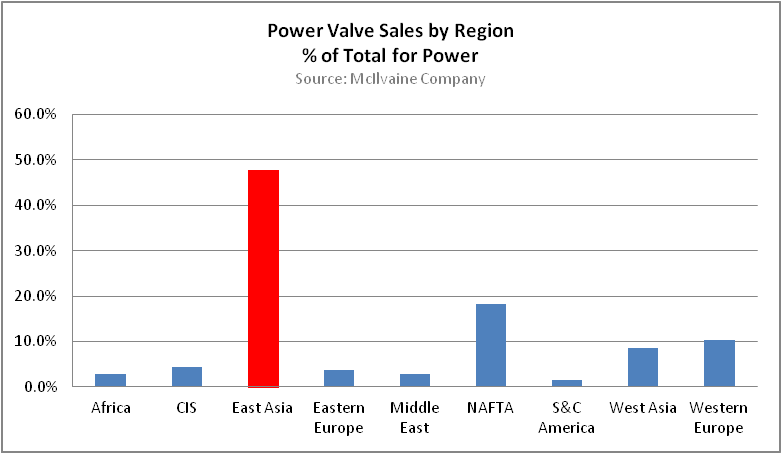
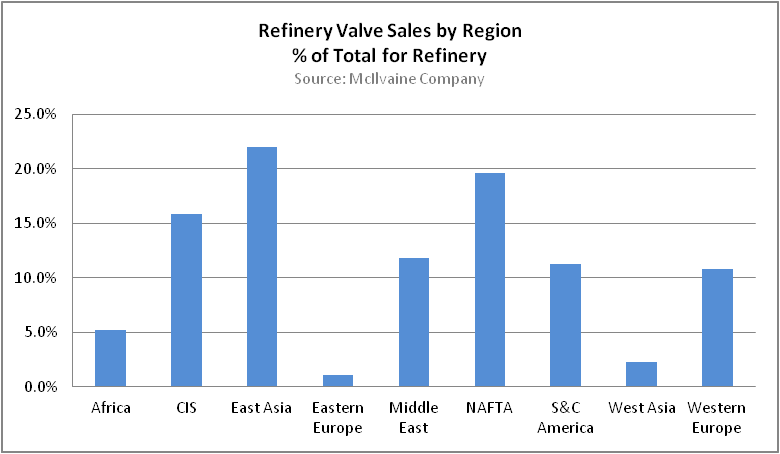
Valve Sales by Geographic Market Segment (%)
Narrative
- The rising position of NAFTA and CIS in the oil & gas market is shown in the first illustration.
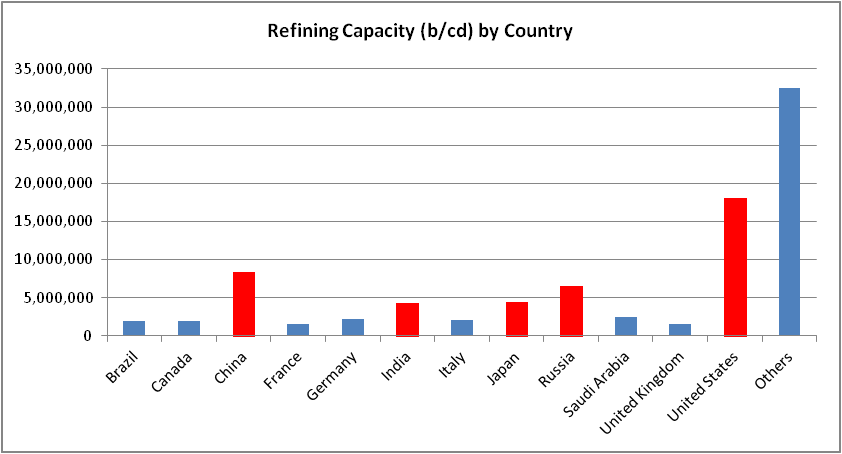
- The rising position of East Asia(China) in the refining sector is shown in the second illustration.
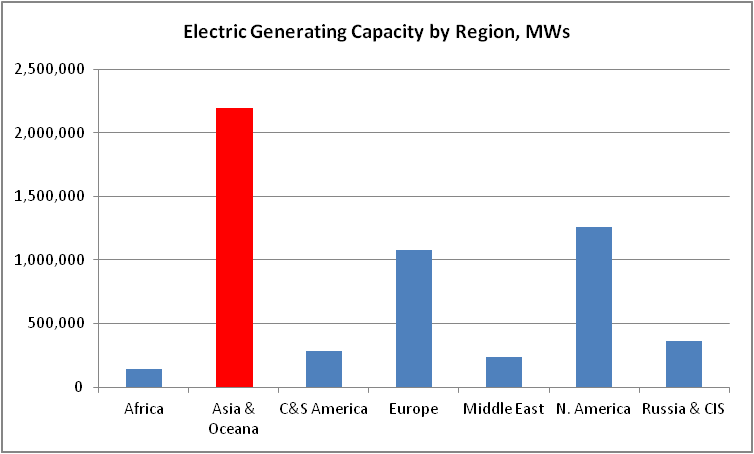
- The overwhelming dominance of East Asia(China) in the power-gen market is shown in the third illustration. China has recently (March 2015) re-started approving licensing for new nuclear reactors that were put on hold after the Fukushima disaster. Currently, China has 26 new nuclear power plants in construction.
Basic Industry Metrics by Region (MWs, barrels per day)
Narrative
- The dominance of the US in the upstream refining sector (installed capacity), and the growing significance of China is shown in the first illustration. It should be noted that while the US has the larger refinery base, the growth rate for new green field refinery capacity is much higher in China.
- The dominance of Asia in electrical generating capacity (China, India, Japan, S.Korea) is shown in the second illustration. Asia also overwhelmingly dominates the rest of world in new greenfield electric power plant construction (both nuclear and coal-fired).
Key Industry Drivers for Valve Sales
Key Drivers for Valve Sales
- Non-OECD Countries: Population growth, urbanization, increased standard of living, increased energy demand
- OECD Countries: Aftermarket sales, infrastructure re-build, technology upgrades
- Power Industry: New installed MWs are a key driver for valve sales in power gen, and the market is
overwhelmingly centered in Asia where new valve-intensive coal-fired and nuclear power plant construction is
proceeding at a fast pace, particularly in China and India. The market in Japan could be substantial in the near
future if the decision is made to permanently remove all 48 nuclear power plants from the grid. At this time, two
nuclear power plants have been approved for re-start, but the fate of the other nuclear plants is still undecided.
Load growth in western Europe and N. America is minimal at this time.
However, fleet restructuring in N.
America to replace coal with combined cycle gas turbine plants provides an attractive valve market. - Oil & Gas/Refinery Industry: New barrels per day oil production is a key driver for the oil & gas and refinery
industries. As shown earlier, N. America has been experiencing a surge in production related to shale gas and oil.
The N. American market has suffered a serious setback at this time due to the collapse in the price of oil, but is
expected to recover slowly over the next several years. Refinery opportunities continue in Asia. - Other Drivers: Increased technological demands on valves, including special alloys for higher temperatures and
pressures in supercritical power plants; improved seal performance for prevention of fugitive gas emissions in oil
& gas markets; improved reliability for valves & actuators in deep subsea applications; to name a few.
Key Valve Applications and Market Sizing by Industry
Power
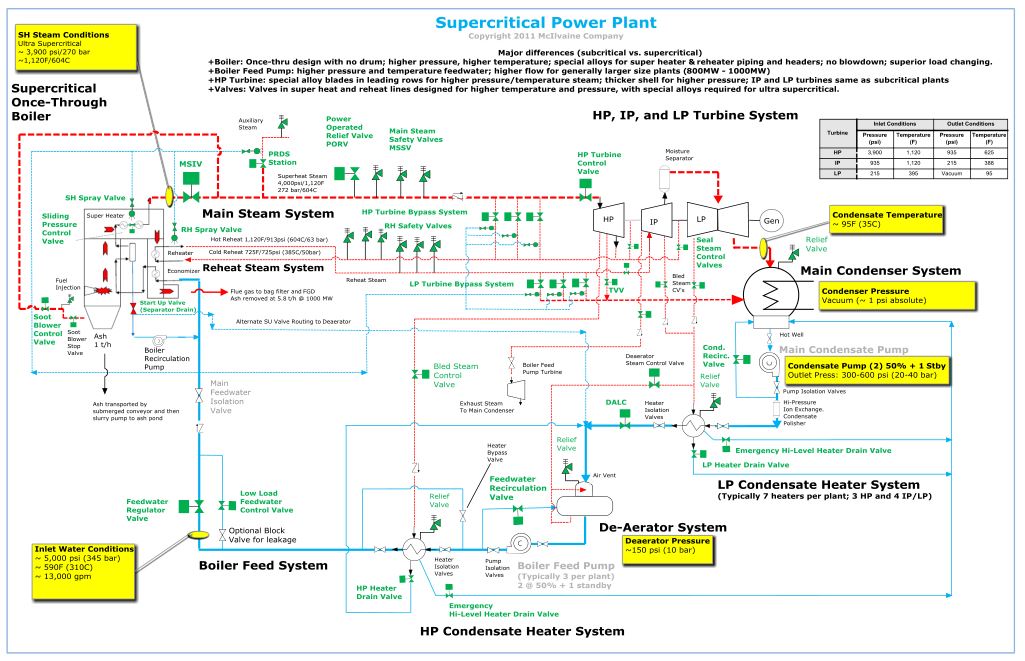
Key Valve Systems
- Feedwater
- Boiler
- Main Steam
- Condensate
- Heater Drain
- Cooling
- Desuperheater
Key Valves - Control
- On/Off
- Safety relief
- Isolation
Key Types - Gate
- Globe
- Ball
- Butterfly
- Check
Narrative
- A typical fossil-fired thermal power plant will have approximately $35-million in valves, with a nuclear plant at $50 to $80-million per plant. Major valve systems shown above for coal-fired plant.
Power
Market Sizing for New Construction
Market Sizing
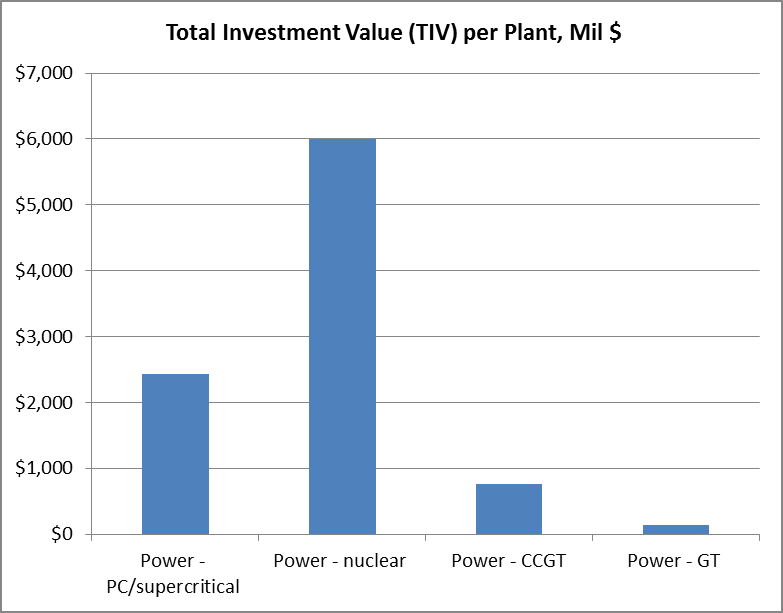
- Approximate total investment cost (TIV) for coal-fired supercritical power plant is $2.5-billion per industry statistics. CCGT is substantially lower, and nuclear more than twice higher.
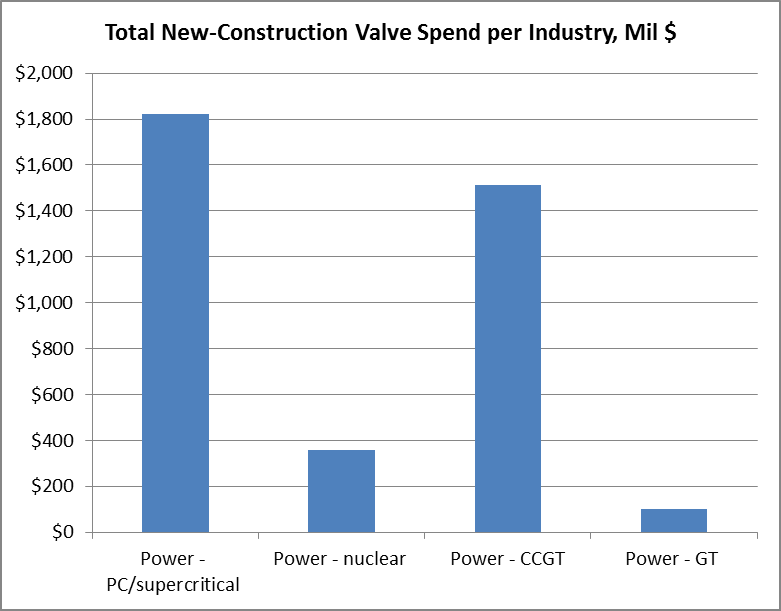
- Approximate valve spend per power plant is in the range of 1% to 1.5% of TIV, or $25-million to $35-million per plant (coal fired). Industry sources estimate $50-million to $80-million per plant for nuclear.
- If 50 new coal-fired plants are brought on line per year in China, the new-valve spend is over $1.5- billion in China, not including aftermarket valve sales. Local sourcing requirements may limit the opportunity for imported valves.
Power
Valves in Gas Turbine Power Plants in Germany (example)
Gas turbine plants in
Germany – In operation
Replacement valve opportunities in
both peaking and combined cycle
plants.
- Fuel delivery and storage
- Air intake
- Combustion
- Generation
- HRSG
- Cooling tower or ACC
- Water treatment
- Wastewater treatment
Germany - Atel Holding Germany - DREWAG –Stadtwerke Dresden GmbH Germany - DREWAG Stadtwerke Dresden Germany - E.ON Kraftwerke GmbH Germany - E.ON Thuringer Energie Germany - EnBW Rhinehafen Germany -
Gemeinschaftskraftwerke Irsching GmbH Germany - GEW RheinEnergie AG Germany - Infraserv GmbH &
Co. Hochst KG Germany - Knapsack Power GmbH & Co KG Germany - Kraftwerk Mainz-Wiesbadan
AG Germany - Kraftwerke Gera GmbH Germany - Mainova AG Germany - Mark E Energie Germany - Mark-E Germany - Mark-E AG Germany - MVV
Energie Germany - NUON Energie und Service GmbH Germany - Papierfabrik Palm GmbH & Co KG Germany - RheinEnergie AG Germany - RWE
AG Germany - RWE Generation Germany - RWE Generation SE Germany - RWE Power Germany - RWE Rheinbraun Germany - Siemens/E. ON Kraftwerke
GmbH Germany - Solvay Chemicals Bielefeld Germany Stadtwerke Bonn
Power
New Gas Turbine Power Plants in Germany (future builds)
| Location Comment | Project Title | Startup Date |
|---|---|---|
| Baden Wurttemberg | Karlsruhe CHP CCGT - Trianel/MiRO Refinery | 2020 |
| Berlin | Klingenberg CHP CCGT - Vattenfall | 2016 |
| North Rhine Westphalia | Krefeld Uedingen CHP CCGT - Trianel | 2019 |
| North Rhine Westphalia | Lausward CCGT - Stadtwerke Dusseldorf | 2018 |
| North Rhine Westphalia | Leverkusen Chempark CCGT - Repower AG | 2018 |
| Berlin | Lichterfelde CHP CCGT - Vattenfall | 2016 |
| Hesse state | Ludwigsau CCGT - Dong Energy | On hold |
| North Rhine Westphalia | Niehl 3 CHP CCGT - RheinEnergie | 2016 |
| Brandenburg | Premnitz CCGT - Alpiq | On hold |
| Bavaria | UPM Schongau CHP CCGT - UPM | 2015 |
| Brandenburg state | Wustermark CCGT - Advanced Power AG | Cancelled |
Refinery
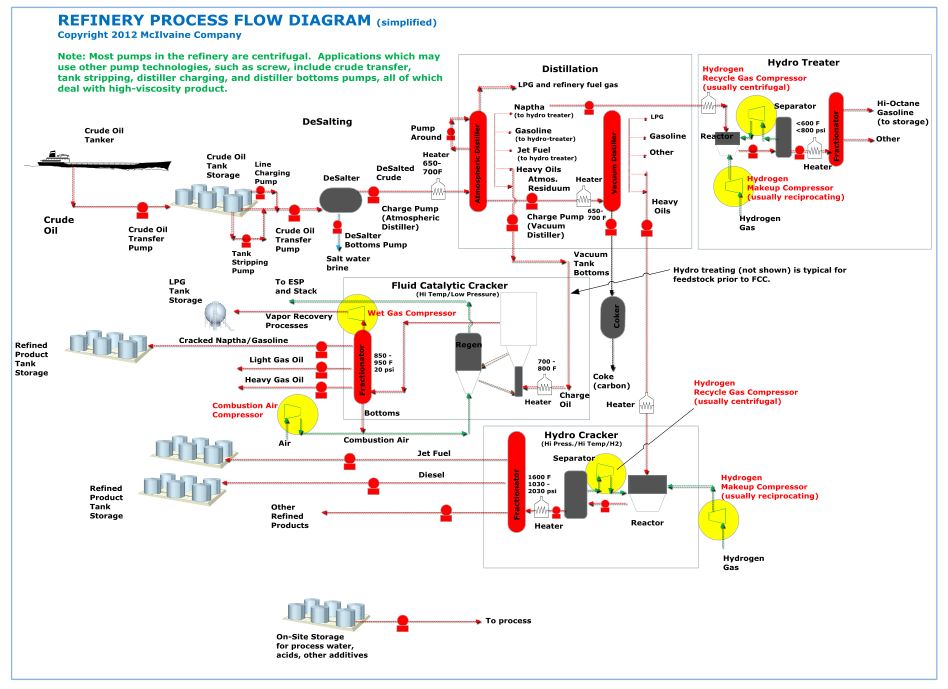
Key Valve Systems
- Atmos. Distiller
- Vacuum Distiller
- Hydro Treater
- Hydro Cracker
- Cat Cracker
- Delayed Coker
- Tank Fill/Drain
- Anti-Surge Valves
- Many others
Key Valves
- Control
- On/Off
- Safety relief
- Isolation
Key Types
- Gate
- Globe
- Ball
- Plug
- Butterfly
- Check
Narrative
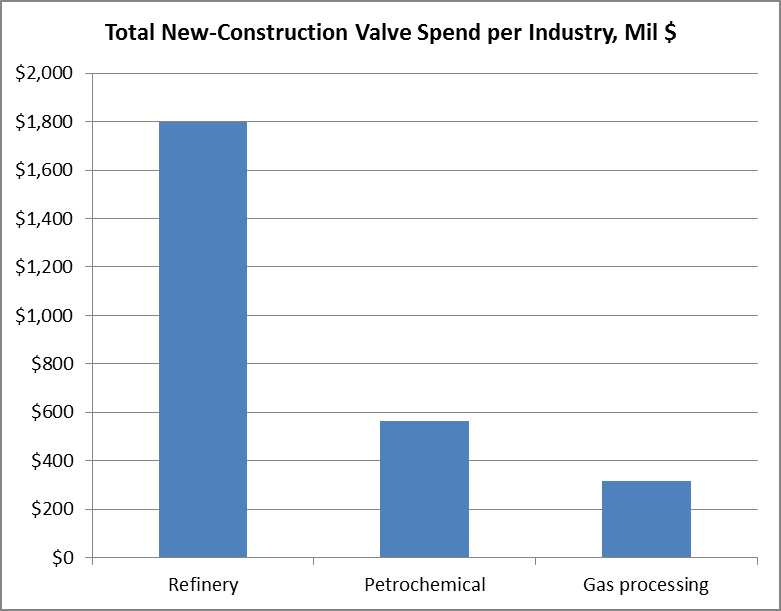
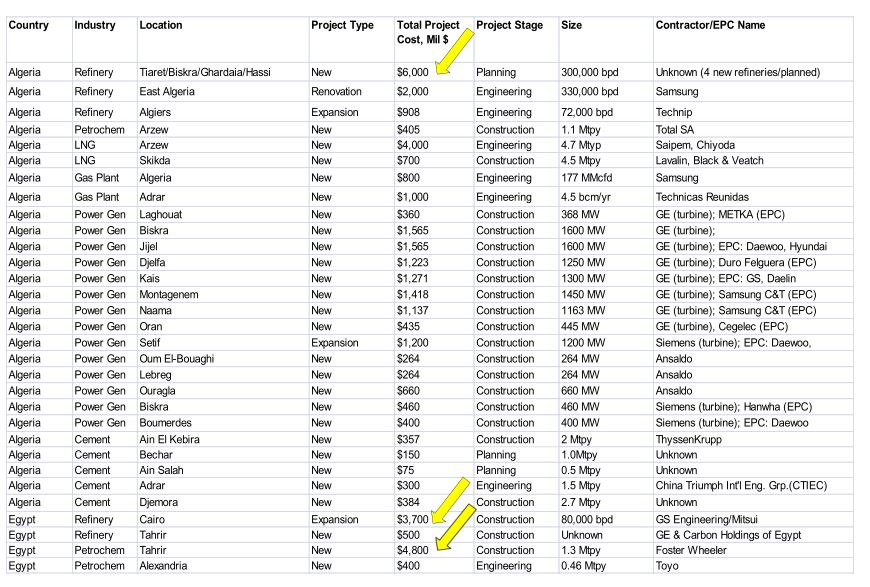
- There are approximately 650 refineries, worldwide. Total valve spend per refinery is approximately $120-million per plant, for new-plant construction. Total plant cost (new construction) is about $6-billion for a large refinery.
Refinery, Petrochemical, Gas Processing
Market Sizing for New Construction
Market Sizing
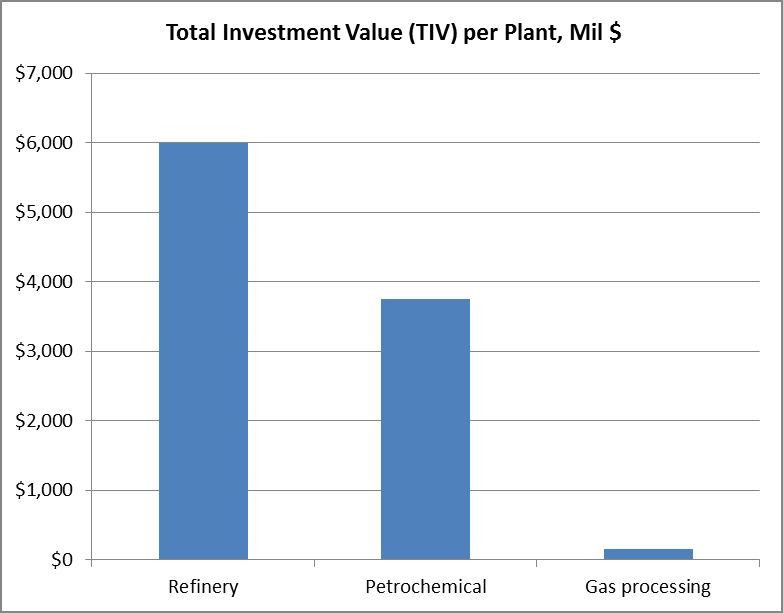
- Approximate total investment cost (TIV) for a new greenfield refinery is approximately $6-billion per industry statistics. Smaller field gas processing plants are more numerous but much lower cost.
- Approximate valve spend per refinery is in the range of 2% of TIV, or $120- million per plant.
- New greenfield refinery construction is focused primarily on the Middle East and Asia, with plant upgrades and capacity additions in the US. The total number of refineries (not capacity) in the US continues to decline due to closures of small inefficient plant
Project Costs (examples for refinery & petrochem)
Assessment Of Geographic
Opportunities
| Primary Industries | Comments |
|---|---|
| Refinery, gas plant, petrochemical | Significant applications in North America, Middle East, North Africa, and China/India particularly in refineries for FCCs and SRUs. Market reflects significant new-builds in the Middle East and Asia, and plant upgrades and expansions in North America. |
| Power | Major opportunities in China, India, for new power plant constructions. Also, significant opportunities for valves in FGD systems in the Middle East and China/India. Mature industry with limited opportunities in OECD countries, with the exception of CCGT plants in North America. |
Review
Opportunities and Threats
OPPORTUNITIES
- Non-OECD Countries: Population growth, urbanization, increased standard of living, increased energy demand
- OECD Countries: Aftermarket sales, infrastructure re-build, technology upgrades, shale gas and oil
- Technology upgrades to meet more severe service conditions for valves (subsea, power plants, etc)
- Increased system automation driving actuator sales
- GHG legislation requiring more stringent performance related to fugitive emissions
THREATS
- Local sourcing requirements for equipment, becoming more common in Latin America, China, and parts of Africa
- Low oil price that constrains entire oil & gas industry and associated equipment sales
- General weakening of China economy
- Strength of US dollar (threat for US suppliers exporting to international markets)
OVERALL
- On balance, conditions look favorable for increased valve sales with economic and technological drivers
outperforming market headwinds, given careful consideration of geographic markets


